
The Building, Before the Drawings: Your Project Team’s Greatest Asset
What if your project team could start working on a building within hours of a survey—without waiting for drawings, PDFs, or emails?
Survey drawings are no longer the starting point—the building itself is.
Through FARO’s Sphere XG, LA Surveys provides clients and their teams with immediate access to a digital twin of their building as soon as scanning is complete. Project teams can review site conditions, interrogate geometry, and collaborate remotely—accelerating early design decisions and reducing uncertainty.
This shifts the measured survey from a static deliverable to a continuously accessible source of truth throughout the project lifecycle.
How it works
Immediately after the scanned data has been processed and the project has been uploaded to SphereXG, a secure link will be shared with the client and their team so they can access the project and take advantage of all the features offered by the platform.
The beauty of Sphere XG is it allows users to upload, view, share, measure, and manage all their point clouds, 360° photos, and 3D models in one unified digital reality platform. At its heart, it is a data-democratising engine. What it does best is break down information silos and place that data in a cloud-based format so that a variety of project stakeholders can access, manage, and analyse it, no matter where they reside.
Below, we outline the key features of FARO Sphere XG and how it enhances the way our survey data is used. The intent is for this to act as a simple user guide for our clients and collaborators.
Overview map
Within days of the survey, the team will have access to the overview map, which is an X-ray of the project, providing a clear layout of the project. If the project has multiple floors, each scan location is colour-coded based on the elevation:
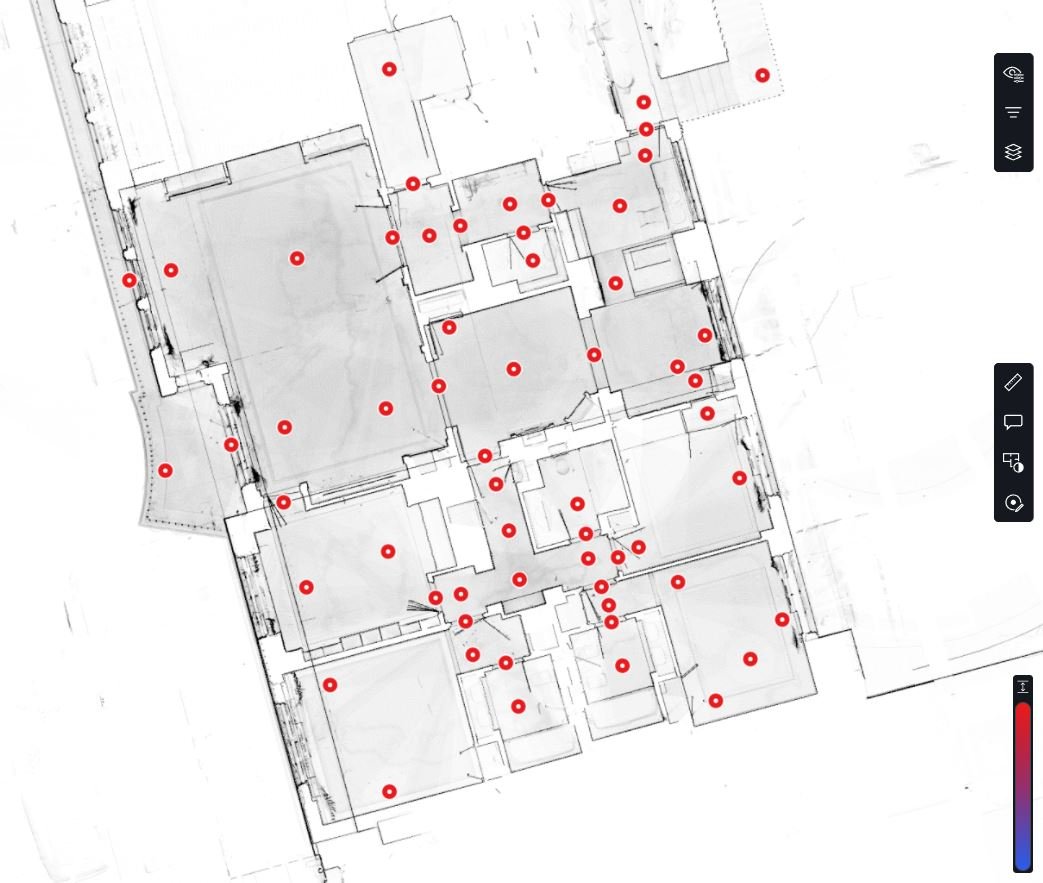
The overview map is the backbone of each project. It allows the user to navigate through the project, visualise the 360° photos, measure and annotate, all features which will be presented on this article.
Viewing and sharing
Once a scan location has been opened, there are 3 ways of viewing the captured information.
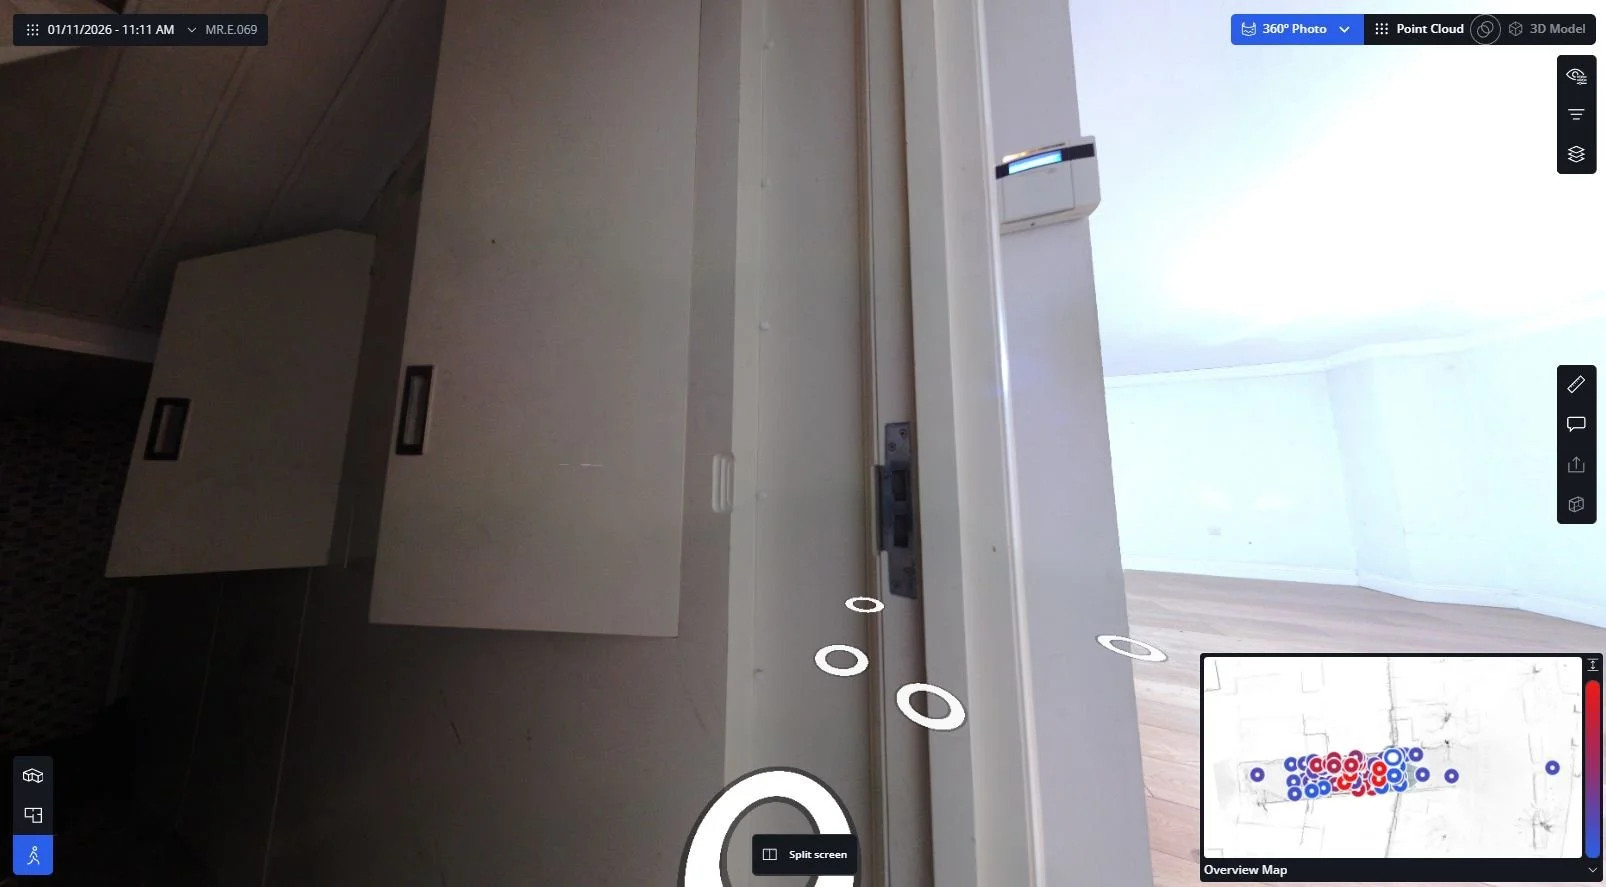
360° Photo
As the internal camera is not a DSLR and the settings can’t be adjusted, the overexposed and underexposed areas won’t have too much information. However, the coloured images are helpful to understand the texture and chromatics of the scene.
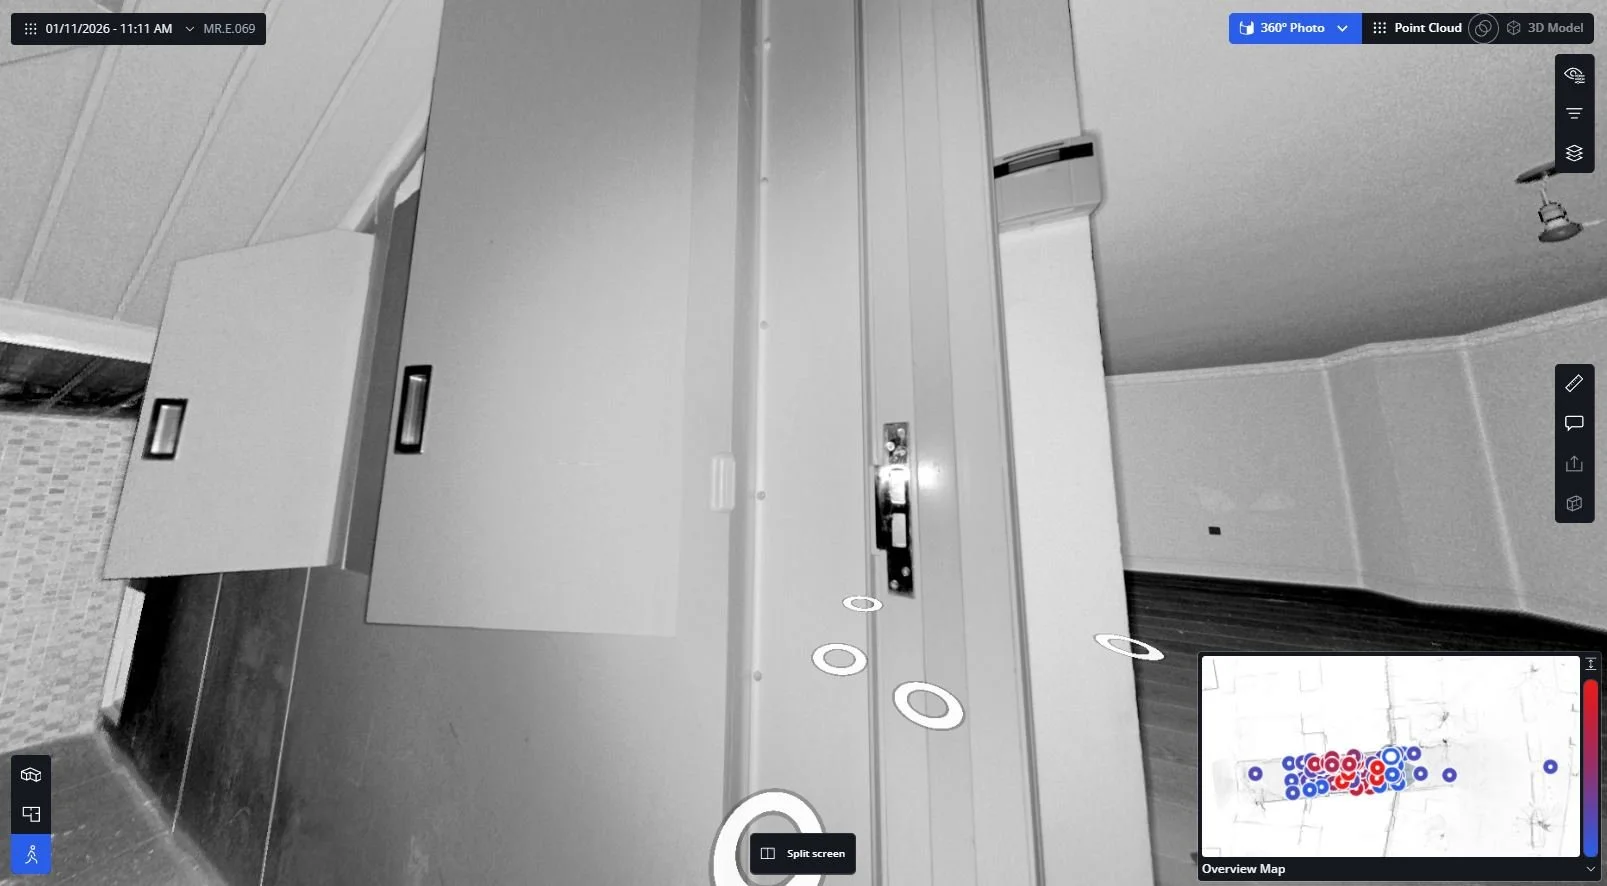
360° Photo - Intensity
An intensity scan (sometimes known as reflectance) is the way the scanner captures the RAW information. It measures and records how reflective a surface is based on the intensity of the laser beam when it returns to the scanner. This is represented as a grayscale image, making the overexposed, underexposed and glazed areas legible.
To switch to intensity, on the top right corner, click on 360° Photo, and from the drop-down select 360° Photo - Intensity.
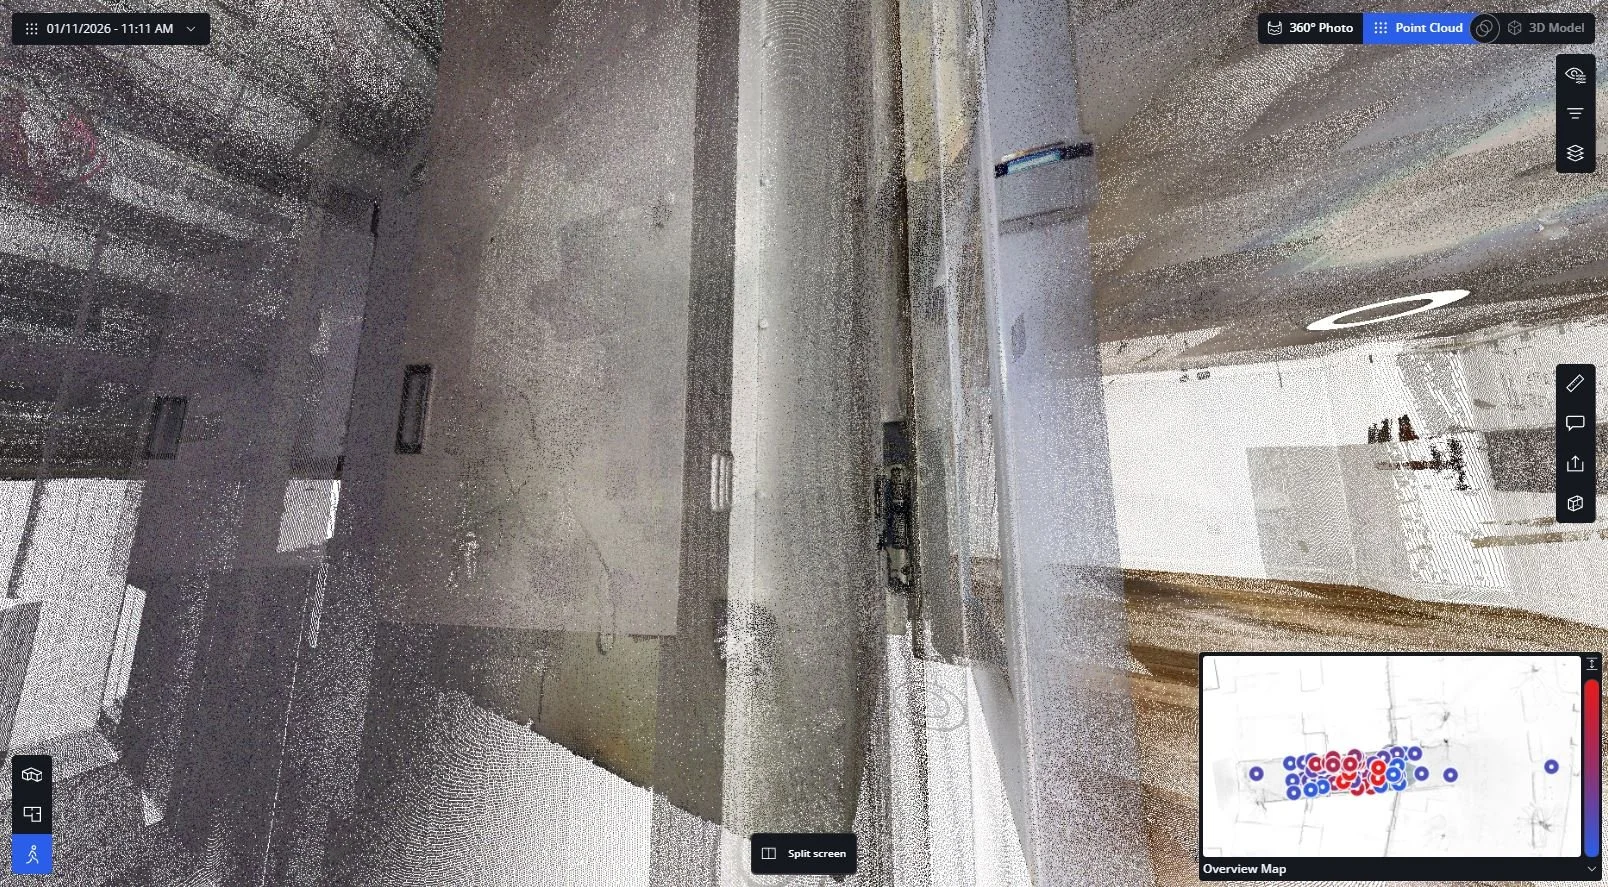
Point cloud
The last option to view the captured information is by switching to Point Cloud, in the top right corner, next to 360° Photo. This viewing option is useful for enabling additional tools (which will be described later), or for flying through the point cloud data, useful when navigating very big models or switching between floors. Once the user has arrived in the desired location, by clicking 360° Photo, they will open the nearest scan location.
To fly through the point cloud, use the keys below:
W - move forward
S - move backwards
A - move left
D - move right
Q - move down
E - move out
Hold the left mouse button - rotate
Hold the right mouse button - pan
Hold the mouse wheel - change elevation
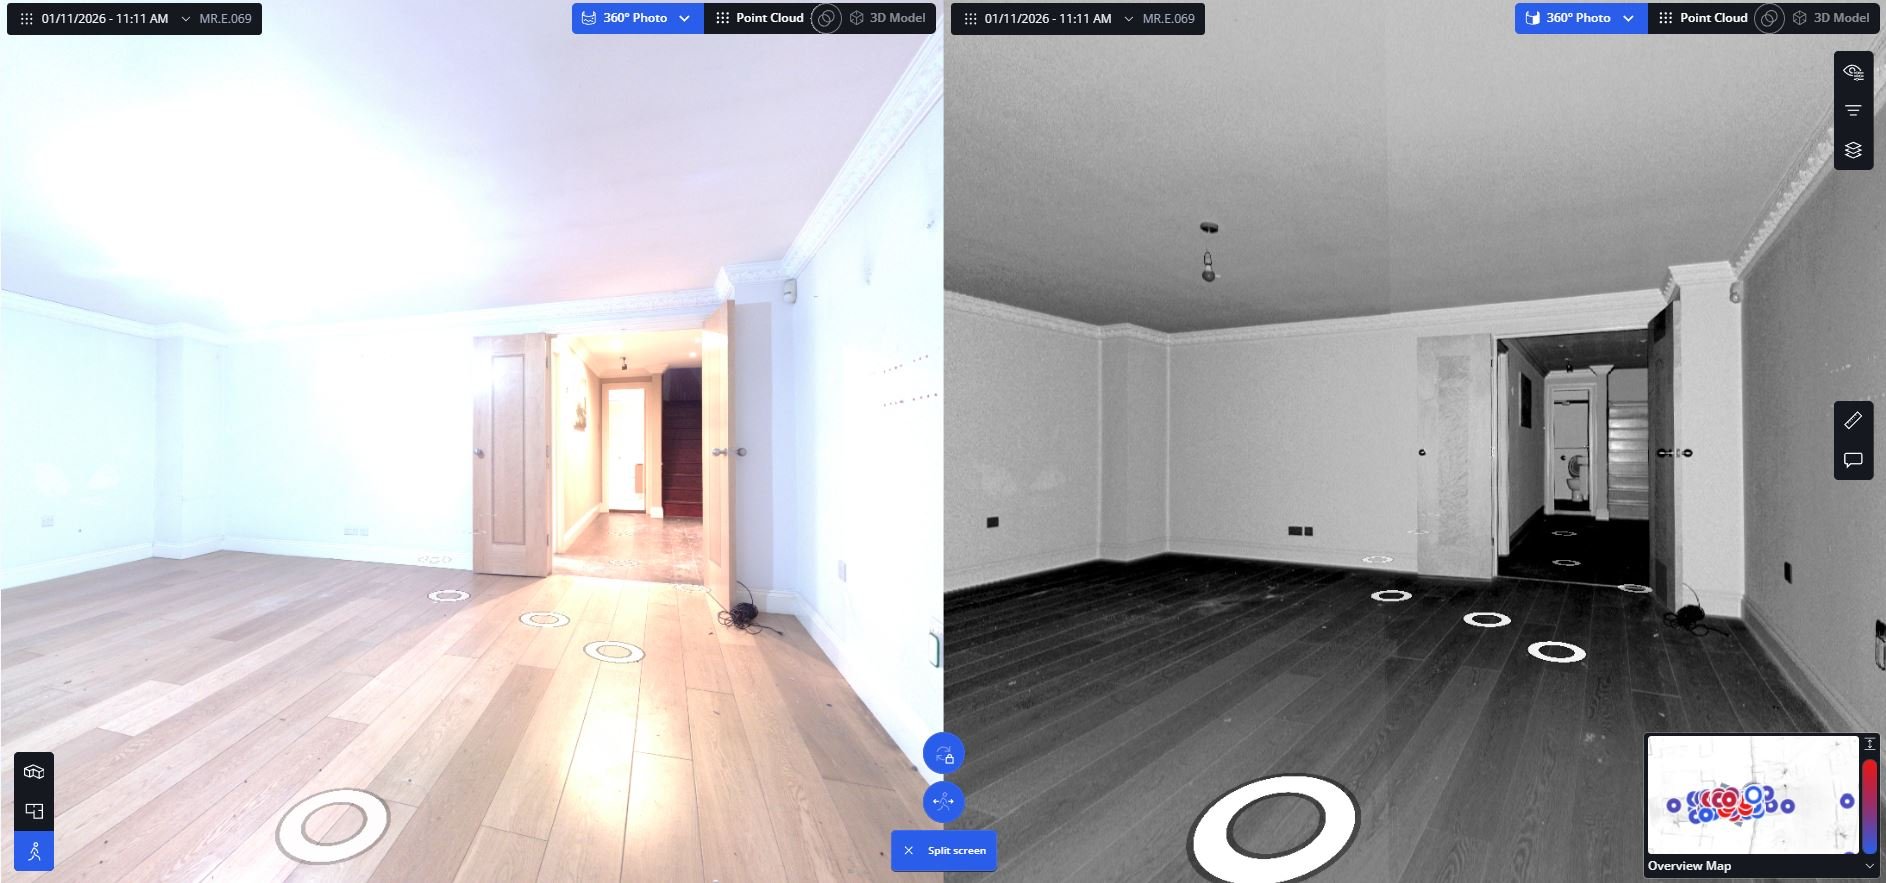
Split View
The split view enables the user to have side-by-side any of the 3 viewing options from above. This is particularly useful when one wants to see both the colour and intensity information.
Measuring and annotating
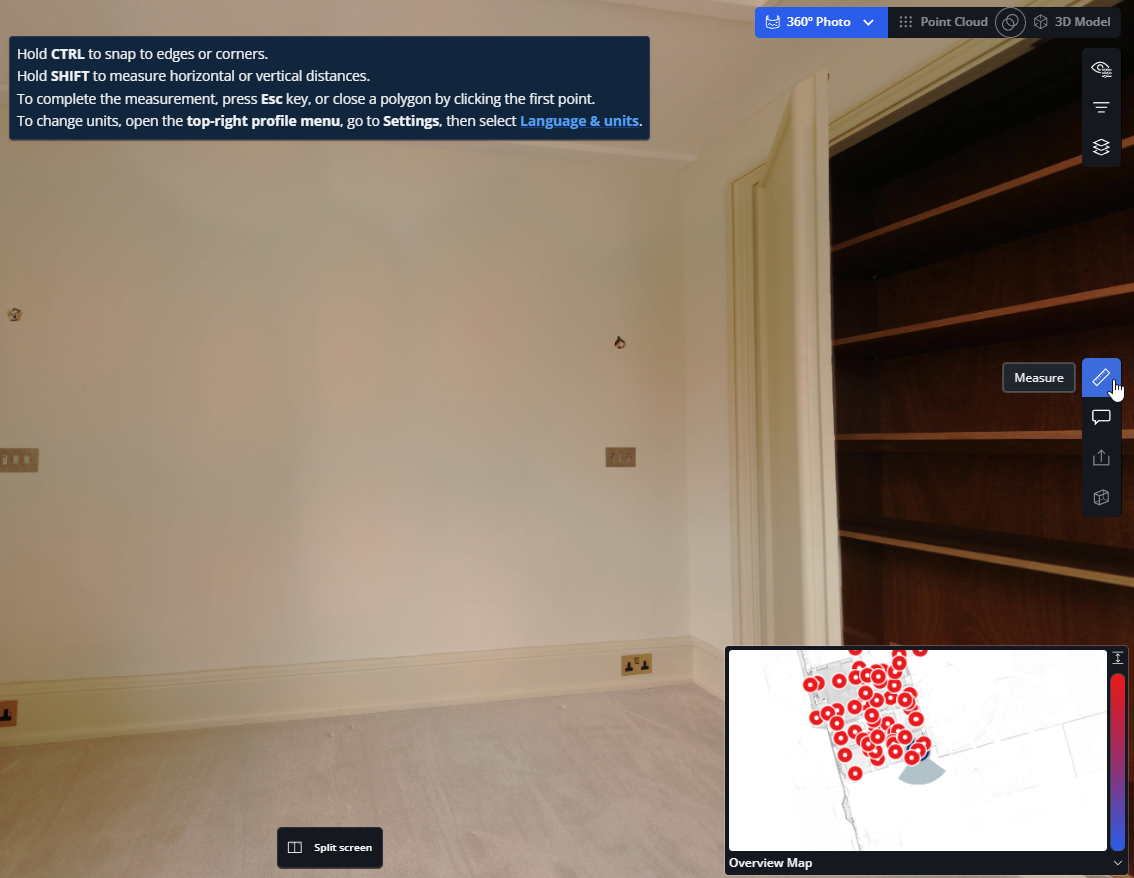
All of the surveys produced by LA Surveys have the point cloud data behind them. As a result, anyone can measure down to the millimetre anything in the 360° photos. To do so, select the Measure tool in the right-hand side palette.
This tool enables the project team to measure anything before receiving the survey drawings, calculate area or work out quantities.
Note: For new accounts, the default might be imperial. This can be changed by clicking on Language & units in the pop-up notification window or by going into Settings.
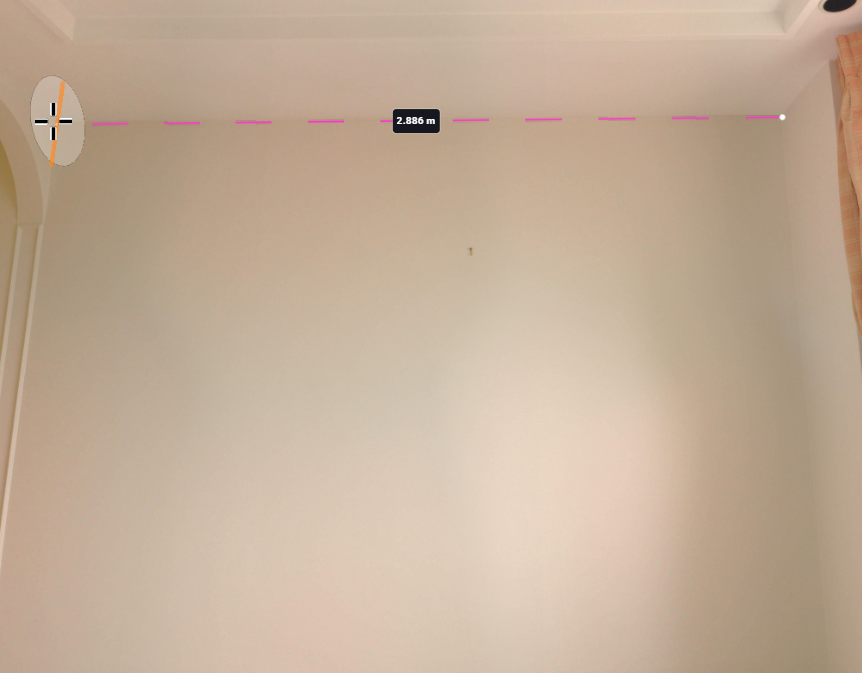
Distance
As it says on the tin, this tool enables the viewer to measure any element which has point cloud data behind it. Holding the Shift key, the cursor will measure in a straight line from the initial measurement point. Pressing the Ctrl key will also enable the snapping function (snapping to edges or corners).
Area
Once a distance has been measured, if continuing to click on all corners of a surface, closing the loop on the starting point, will generate dimensions for all distances between the points, a cumulative distance, and the area of the surface.

Annotation
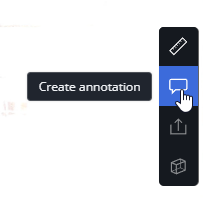
The annotation tool can be used either as a reminder or as a collaborative tool, which assigns notes or actions to various members of the team.
Areas or specific elements can be annotated. In the example below, the area of the wall has been annotated as wallpaper, which enables the user to work out the cost for wallpapering that wall within seconds. Another annotation has been added for a socket.
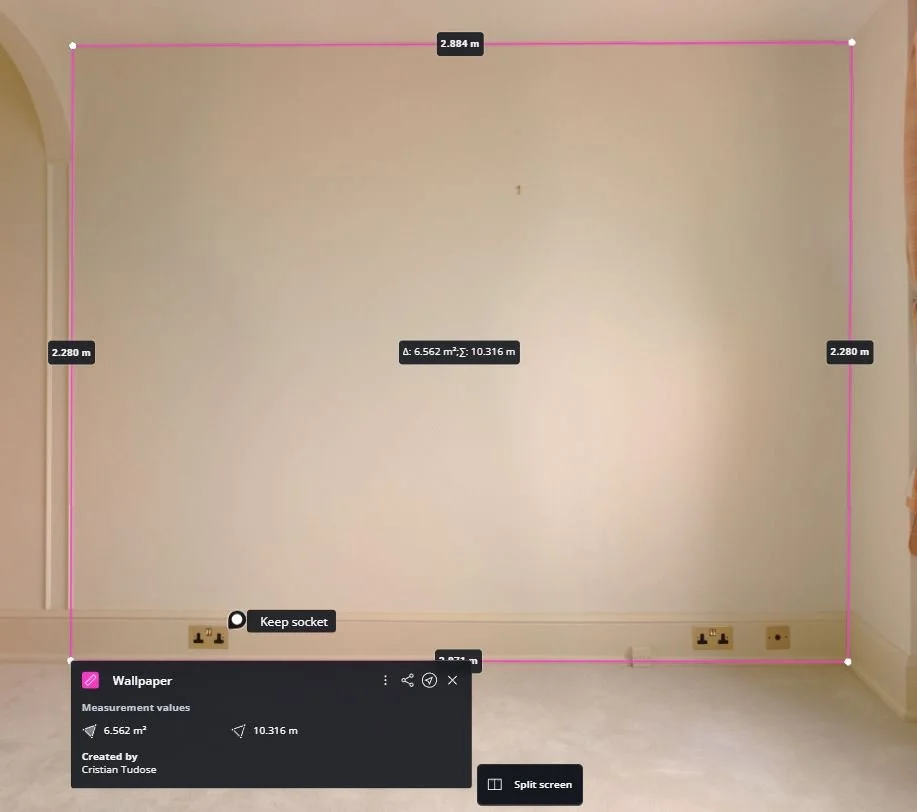
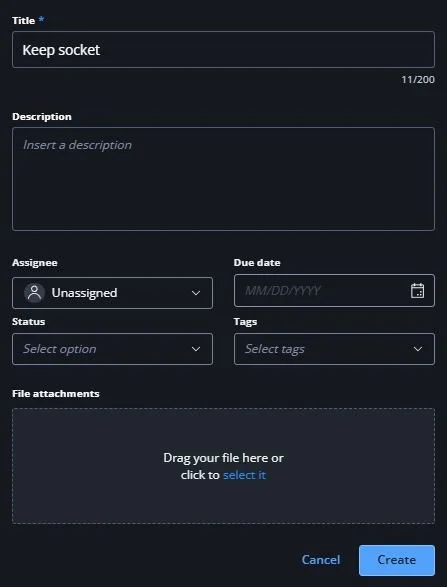
In both instances, the annotations can be assigned to someone in the project team, they can receive a status, a due date and a tag. Lastly, a file can be attached to that annotation, this being a spec for the wallpaper or a layout with the interior elevations of the room.

All the annotations can then be viewed, searched or filtered on the left-hand side palette. The icon with an arrow (Go to annotation) will teleport the viewer directly to that annotation on the photo.
Clicking the three dots will allow you to share, edit or delete the specific annotation.
Clipping boxes
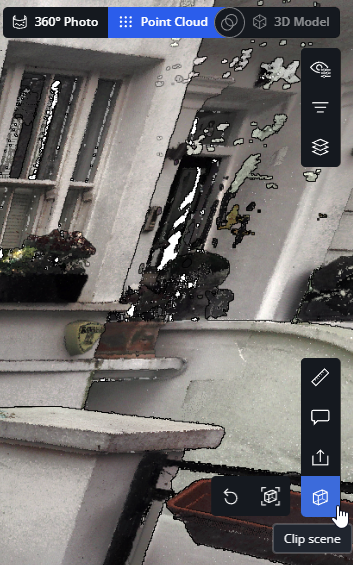
In the Point Cloud tab, selecting the Clip Scene option will allow the user to create a cutout through the point cloud. This is particularly useful to create 3D sections on the spot and check areas which might be unknown.
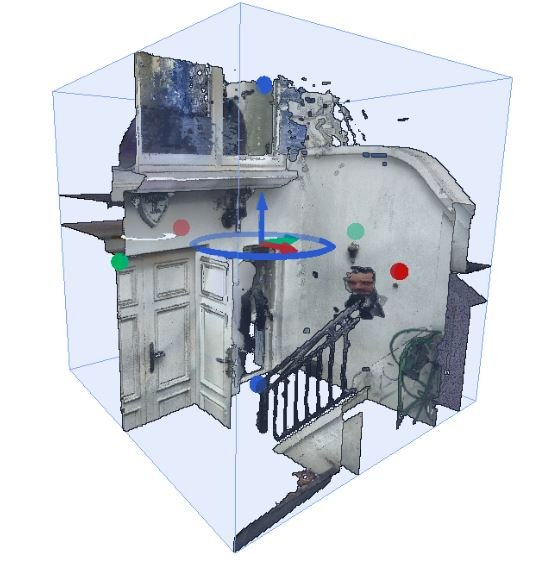
Once the Auto-clip option has been clicked, this will generate a cube which cuts through the model. The size can be adjusted by pushing and pulling the green, red and blue dots.
The video below illustrates how the clipping boxes, along with all the other features presented above (measuring and annotating), can be used to create a 3D sections through a building and measure the overall height of the property within seconds.
Point Cloud Analysis
The point cloud analysis tool can be activated only in the 3D overview (top option in the bottom left palette) - see all options highlighted in blue.
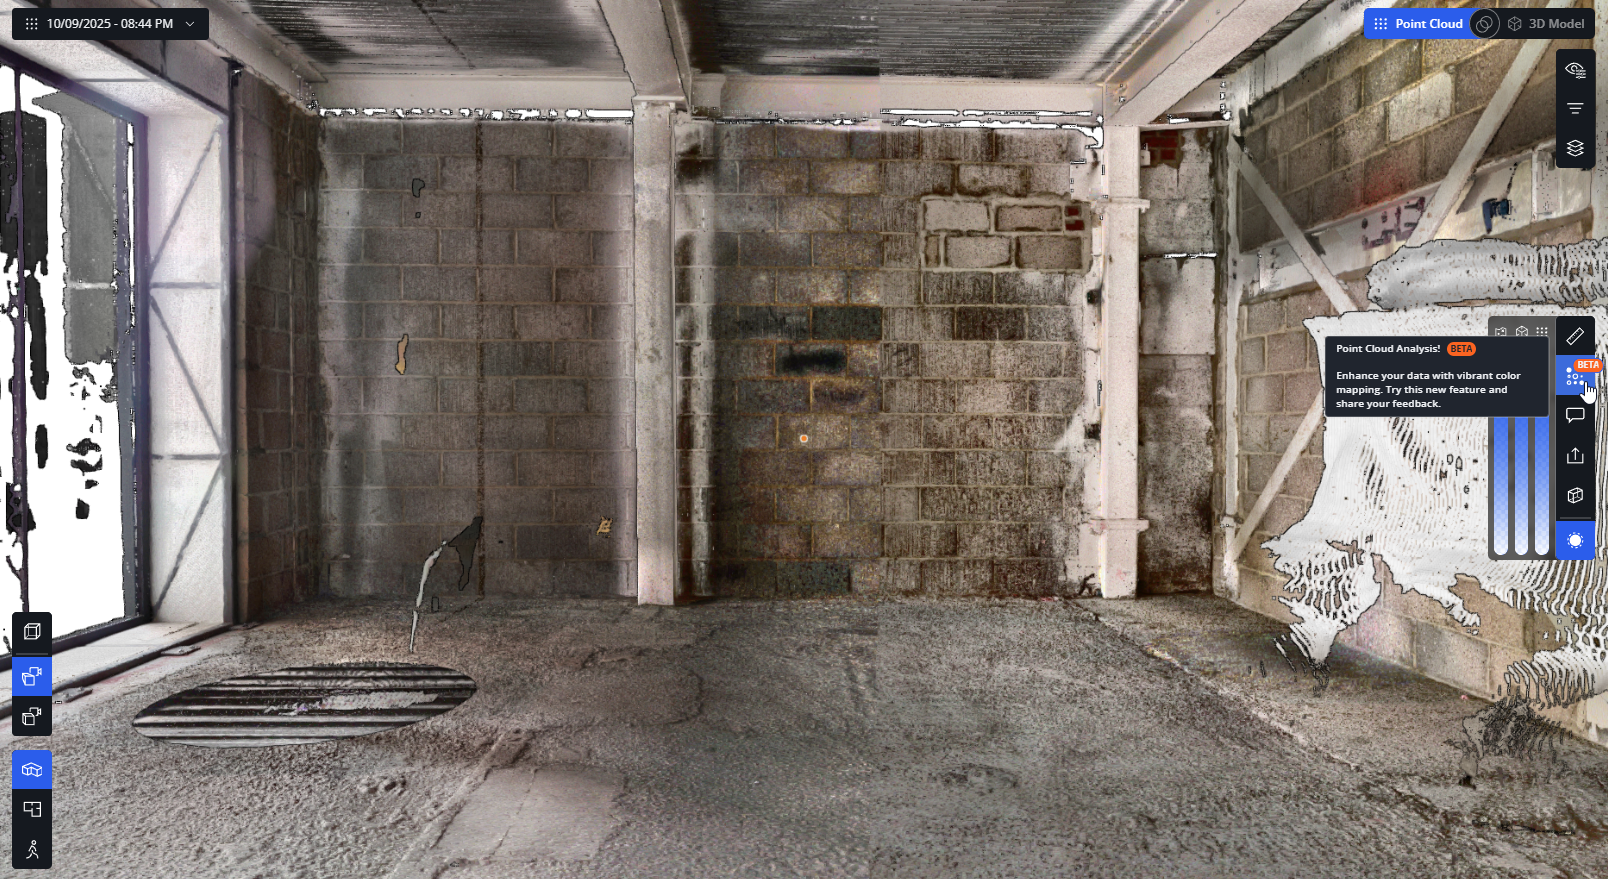
Once the tool has been selected, draw an area similar to how you would with the measuring tool. When closing the loop, an arbitrary reference plane will be created (this can not be adjusted), and from it, the user can add labels, which will show the deviation from the reference plane.
The point cloud analysis tool can be used on any of the point cloud information to check the flatness, level, elevation or plumb, whilst adjusting the tolerance and the range of the tool.
At the end, a report can be generated and shared with anyone.
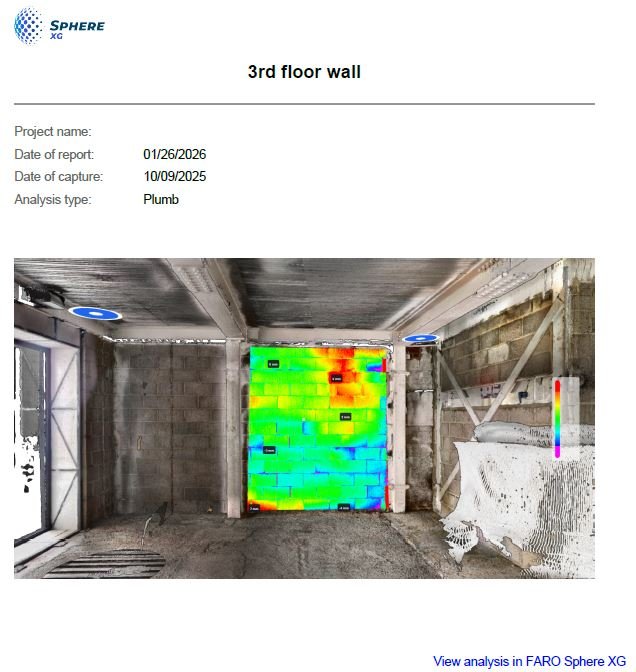
Point cloud analysis report from SphereXG
Procore integration (Beta version)
FARO Sphere® XG (formerly HoloBuilder) allows us to upload, view, share, measure, and manage all our point clouds, 360° photos, and 3D models within one unified digital reality platform. The new integration with Procore allows users to sync the Sphere XG annotation with Procore Observations and RFIs, for immersive visual 3D/360° context. Be up-to-date about site conditions wherever you are and make informed decisions, along with sharing exact information.
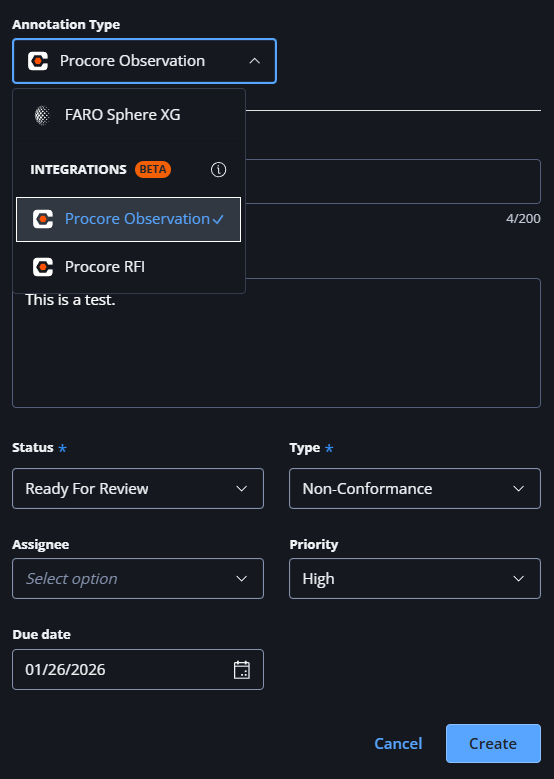
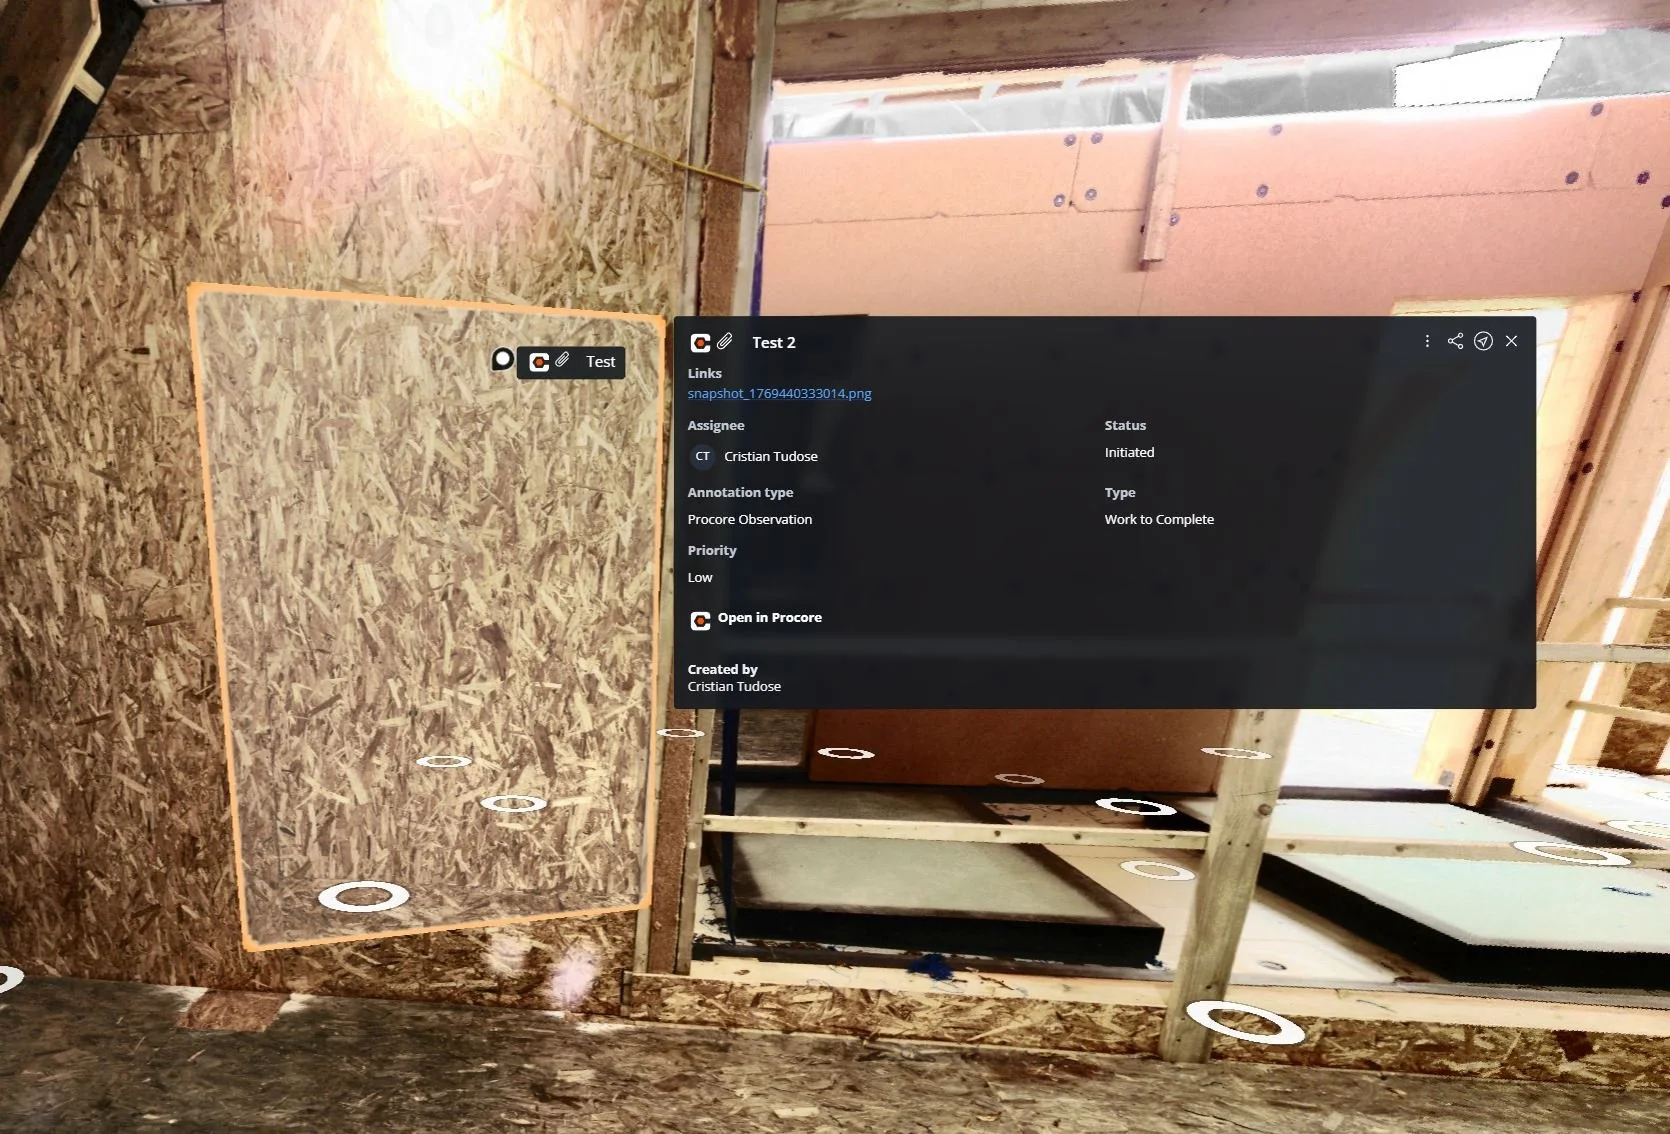
Procore Observation
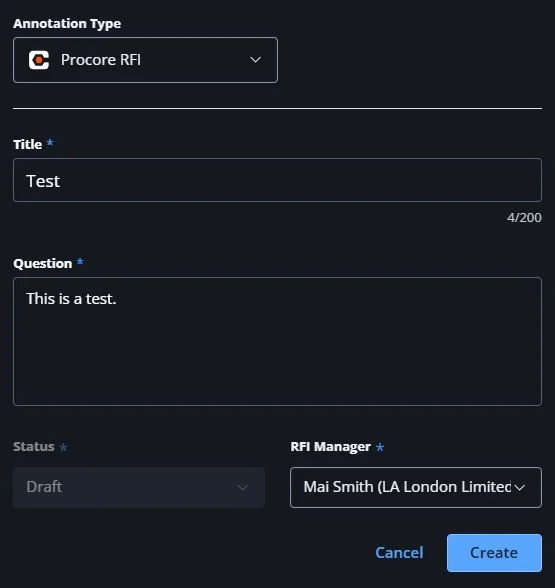
Procore RFI
Using the same annotation tool, the user will be able to change between the Annotation Types. Procore Observation allows the user to set a status for the observation, a type (commissioning, environmental, safety, quality, etc.), assign it to a member of the project team, set a priority and a due date. In a similar manner, a Procore RFI can be created. In both instances, these can be marked either as a pinpoint or an area, being visible in all the scans from that floor or in the overview map.
Disclaimer: please keep in mind that some of these features are in beta testing at the time of writing. SphereXG undergoes continuous development and some features might evolve.
Don’t forget
Our 3D measured surveys are fast, reliable, and delivered with the rigour and insight that only architects can provide. LA Surveys delivers a premium and unique service.
To discuss a project or request a survey quotation, please contact us.